Explore complete financials for companies worldwide
Get accurate, structured financials for private and public companies worldwide — revenue, margins, balance sheet, cashflows, and performance trends, all in one place.
Quickly analyse complete financial statements, compare performance across peers, and uncover revenue and margin trends for companies across global markets.
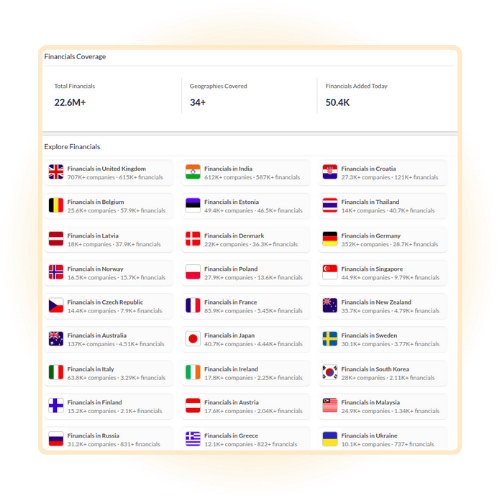
Exhaustive global coverage
Access 20M+ financials for companies across 30+ countries, updated continuously to help you monitor markets and spot emerging opportunities.
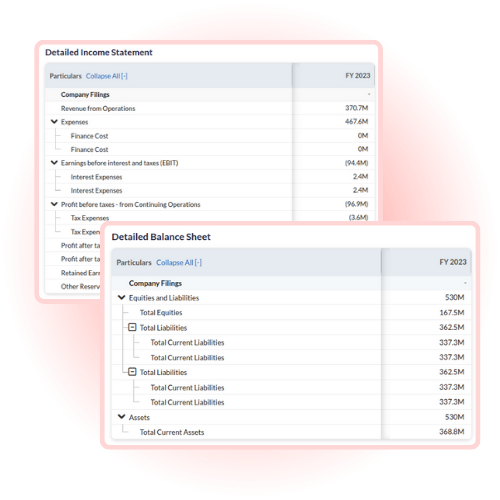
Detailed financial statements
Review detailed, structured financial statements that give you a clear view of a company’s fundamentals — including revenue, profitability, balance sheet strength, and cashflows.
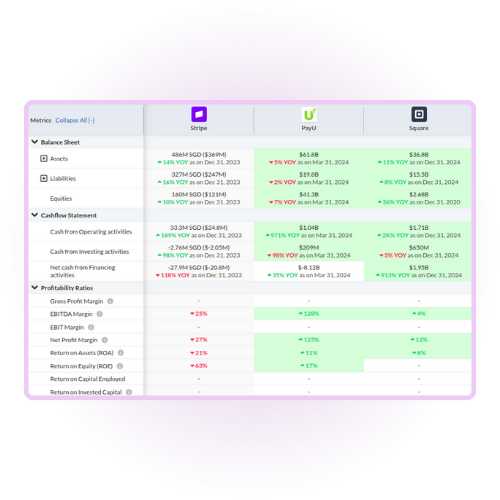
Performance benchmarking
Compare companies using consistent financial metrics, analyse historical performance patterns, and uncover trends that reveal long-term growth trajectories.
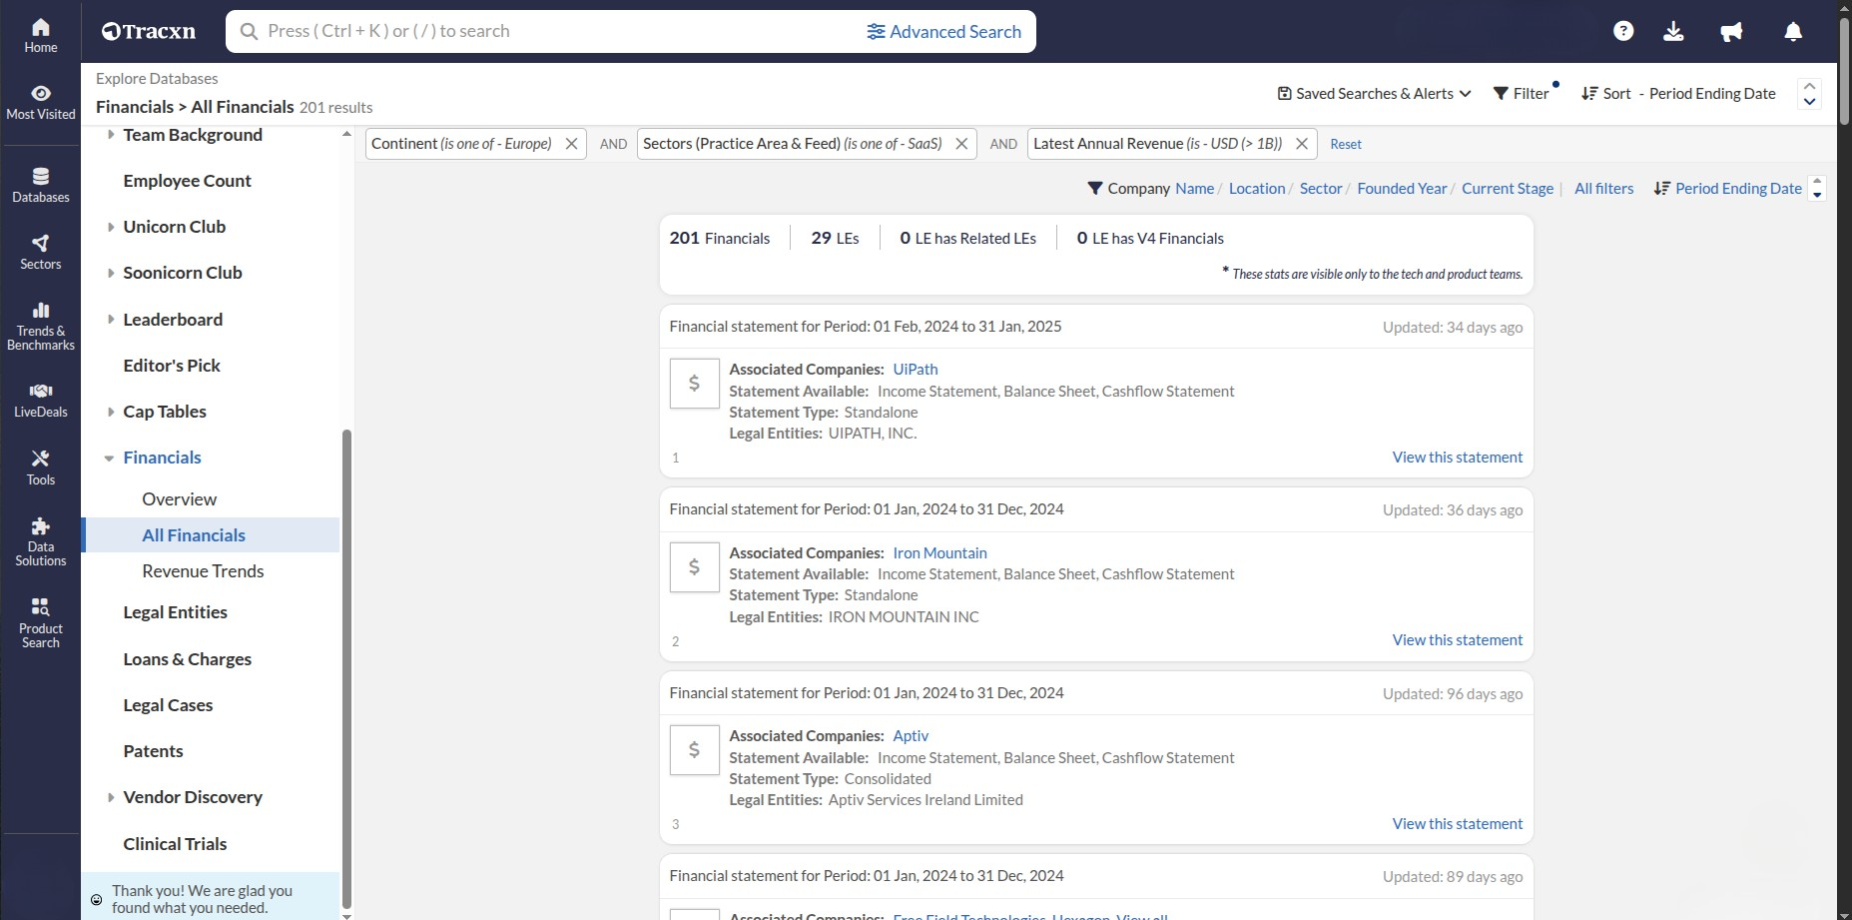
Discover what's possible with Tracxn
See how Tracxn’s financials data helps you compare peers, validate performance, uncover trends, and make confident investment or strategic decisions.
Get me the financials of the SaaS companies in Europe with latest annual revenue >$1B
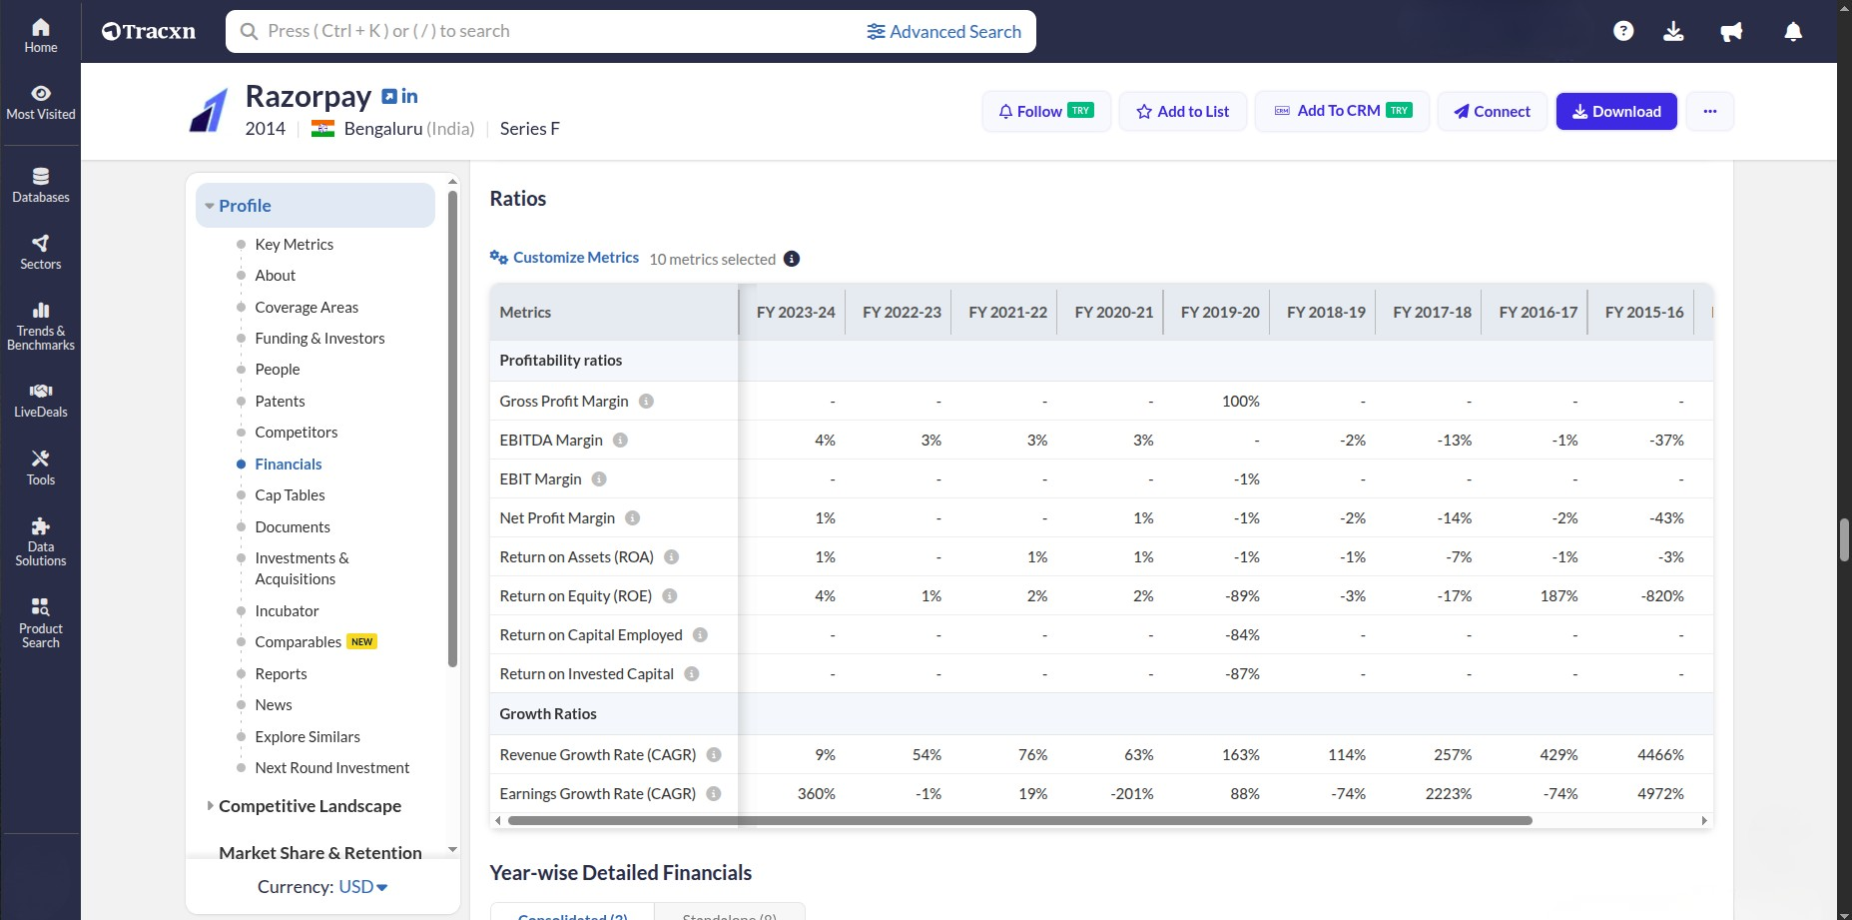
What is the 3-year revenue CAGR and net profit trend for Razorpay?
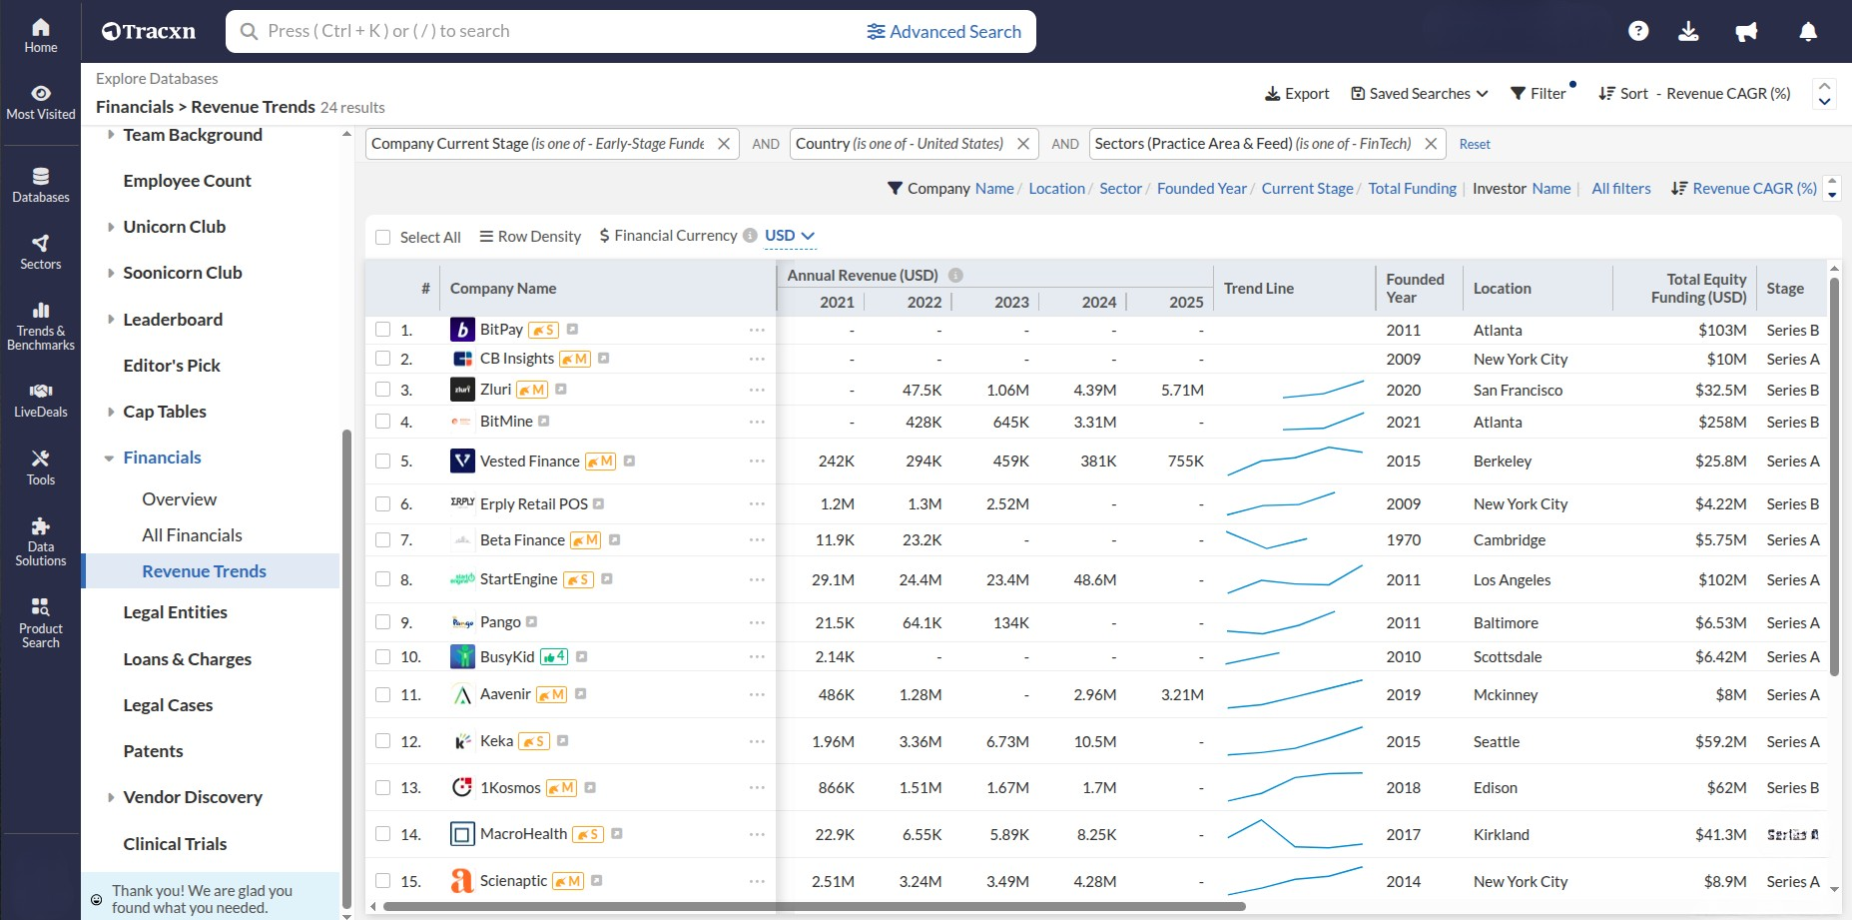
What are the historical revenue trends for early-stage FinTech companies in the US?
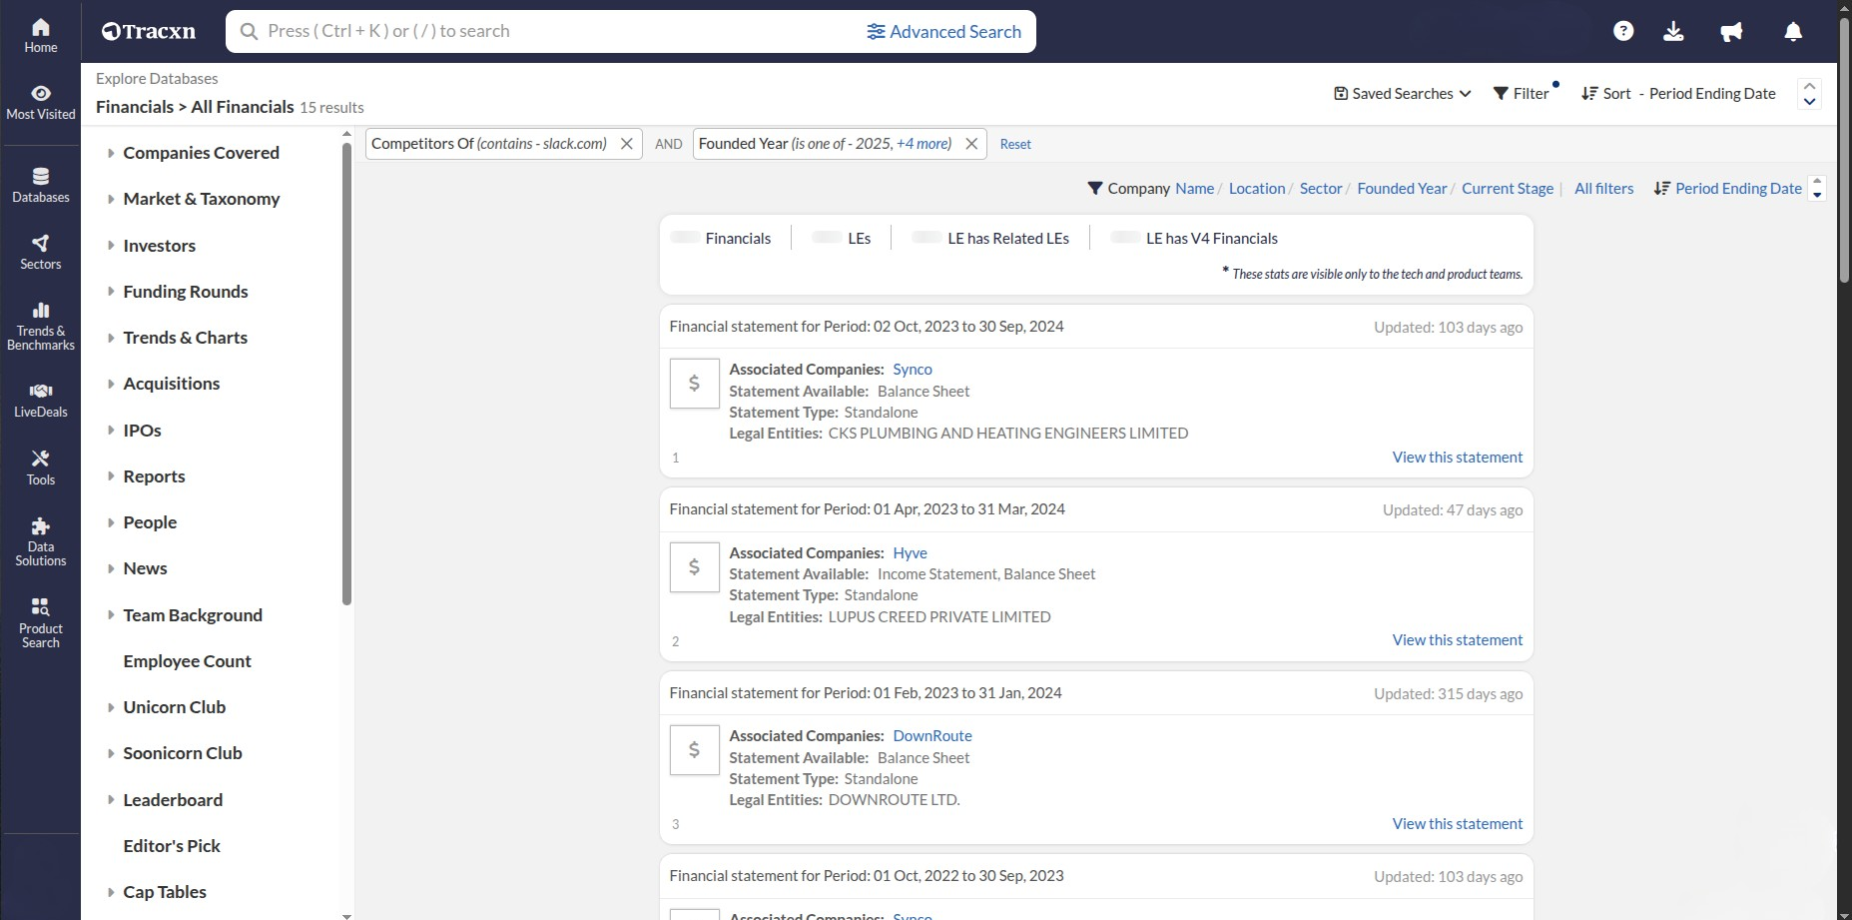
What are the financials for Slack competitors founded in the last 5 years?
Evaluate performance with historical trends
Gain a deeper understanding of company growth by analysing historical performance and identifying long-term shifts using the latest financial data.
1 year, 3 year, and 5 year CAGR numbers
Latest and historical financial numbers
Compare revenue and P&L trends
Join thousands of teams using Tracxn to track global funding activity


.png)
.png)
.png)